The simplest definition of point bars is that they are sedimentary deposits forming on the inner, convex bank of river bends. [‘Inner’ and ‘convex’ bank means that, looking toward the river, the bank is curving around you.] Amadeus W. Grabau, an early ‘influencer’ in stratigraphy and sedimentary geology, published a beautiful drawing of how meanders grow, point bars evolve, and oxbow lakes form, more than a hundred years ago:

Diagram illustrating the development of meanders in a river. From Grabau (1920).
In other words, inner, convex banks in a meandering river are depositional; and outer, concave banks are erosional. Although some of the bends in Grabau’s figure become asymmetric through time, this rule still applies, and it seems like he wanted to emphasize that the asymmetry can go both ways relative to the flow direction.
Although relatively simplistic representations like these are still common, it has been recognized more than 50 years ago that deposition in meandering rivers can occur on the ‘wrong’ side as well, that is, on the concave bank. The figure below comes from a 1982 paper by Page and Nanson and it illustrates the difference between point bars and ‘concave bench deposits’. They also notice that the concave-bank deposits are finer grained than the point bars, they are associated with downstream translation of the entire channel bend, and this translation seems to be the result of confinement by a valley wall that is resistant to erosion.

Confined meanders of the Fort Nelson River, British Columbia, Canada. From Page and Nanson (1982)
The late Derald Smith, a geomorphologist and sedimentologist at the University of Calgary, was fascinated by these geomorphological features and the underlying deposits. Along the Peace River in Alberta, he and his group took cores from the banks and found that the deposits change from typical fining-upward, but overall sand-rich point bar deposits to silt- and mud-dominated sediments along the concave bank. He used the term “counter point bar” for these features; and, just like Page and Nanson and others did before, thought that the translation needed for the development of counter point bars was driven by confinement, that is, the presence of some erosion-resistant substrate along the outer side of the bend. This idea is well expressed in this sketch from an important 2009 paper that was published in Sedimentology:

Plan-view expression of point bars and counter point bars. From Smith et al. (2009)
In the case of the Peace River meanders it is more difficult to discern the presence of some confining substrate. Note the ‘causality?’ comment in the figure above, attached to one of the counter point bars that seemed particularly problematic to interpret. Such apparently unconfined counter point bars are quite common satellite imagery; here are a few bends from the Purus River in Brazil (recent deposition on bars is highlighted first, then curvature arrows and inflection points, and counter point bars in brown):

Three point bars on the Purus River in Brazil that continue as counter point bars beyond the inflection point (the point of zero curvature).
In a paper that was recently published in the journal GSA Bulletin, we explore the idea that counter point bars can form without significant variations in substrate erodibility, as donwstream translation is a fundamental part of the fluvial meandering process. Scientists who have worked on mathematical models of meandering have known for some time that the meandering process doesn’t work well if meanders are only allowed to increase in amplitude and there is no other component in channel migration. For example, Howard and Knutson (1984) noted that, in their (relatively) simple numerical simulations, “low-amplitude meanders migrate (translate) rapidly downstream, but as their amplitude increases, the translation diminishes, so that the inflection points (crossovers) between loops become relatively fixed.”
The reason for this downstream translation is that, both in mathematical models and in nature, the magnitude of channel migration is spatially delayed relative to curvature. This delay is the result of the fact that migration rate does not depend only on the local curvature, but it is the weighted sum of upstream curvatures. The largest migration rates will be downstream of the river segment with the highest curvatures; and this downstream lag is roughly constant for river segments of similar scales; see more about this in another, related paper (Sylvester et al., 2019). The following animation shows the distribution of curvature and migration rate values along a few bends in a model channel:
Animation showing the distribution of curvature and migration rate along a few synthetic meanders
You can see in this animation how the migration rates are asymetrically distributed around these bends, suggesting that the corresponding point bars would extend downstream beyond the point of zero curvature, just like they do in the Purus River example above. Looking at these bends, the question arises: does this asymmetry affect all meander bends to the same degree? Or does the size of the meanders matter? A channel segment with a larger variability in bend size holds the answer:
Animation showing the distribution of curvature, migration rate, and bar type index along meanders of variable size
Small bends have higher curvatures, higher migration rates, and a more pronounced asymmetry in the distribution of migration, and therefore better developed counter point bars, than the three large bends in the middle of the image above. One way to quantify and visualize the locations of counter point bars along the channel is to compute the product of dimensionless curvature and dimensionless migration rate. We called this parameter “bar type index” and you can see its distribution along the channel in the last few frames of the animation above. Locations where the bar type index are negative are shown in blue; they tend to occur on the upstream side of relatively short and high-curvature bends. The large meanders in the middle are characterized by either slowly growing point bars (light pink colors) or very limited change (very close to white).
We can see how the variability in bend size develops by looking at the evolution of the channel through time:
40 time steps from a simple meandering model, colored by the 'bar type index'. Blue colors correspond to locations of likely counter point bar development.
Most of the bars have a positive bar type index (pink to red colors above); in other words, most bars are ‘proper’ point bars. The length of the segments with negative bar type indices, and therefore the length of the counter point bars, is set by the characteristic lag between curvature and migration rate. Not all downstream translation is associated with strong blue colors; this suggests that high curvatures are also needed for well-defined counter point bars. Also, it is obvious where the small meanders come from: they initiate at neck cutoffs. The idea of an ideal meander size and shape is always attractive, but change and disequilibrium are fundamental parts of the meandering process. Simply put, the cutoff-related small bends migrate as quickly as they do because the local stresses on the river banks are the highest; but even the largest and oldest meanders change through time, although the change is slower.
Examples from the Mamoré River, Bolivia
The question is, of course, whether these types of counter point bars are present in actual - not digital - meandering rivers. To answer that question, detailed measurements of curvature and migration rates are needed, over a significant time period. That’s what we did on a 375-km-long segment of the Mamoré River in Bolivia, using mapping techniques that are documented in a Github repository called ‘channelmapper’. In addition to mapping the banks and the centerlines for 30 time steps that span 32 years, we have also written some code to split every channel planform into 25-m-wide short segments which then can be used to display various attributes along the channel and to create maps of the deposits that are left behind as the river migrates:

Splitting a channel planform into 25-m-wide polygons, that do not overlap each other, not even in tight bends
The result of bank accretion and erosion can be visualized using cropped versions of these polygons:

Elements used to map the deposits of the river, colored by the bar type index
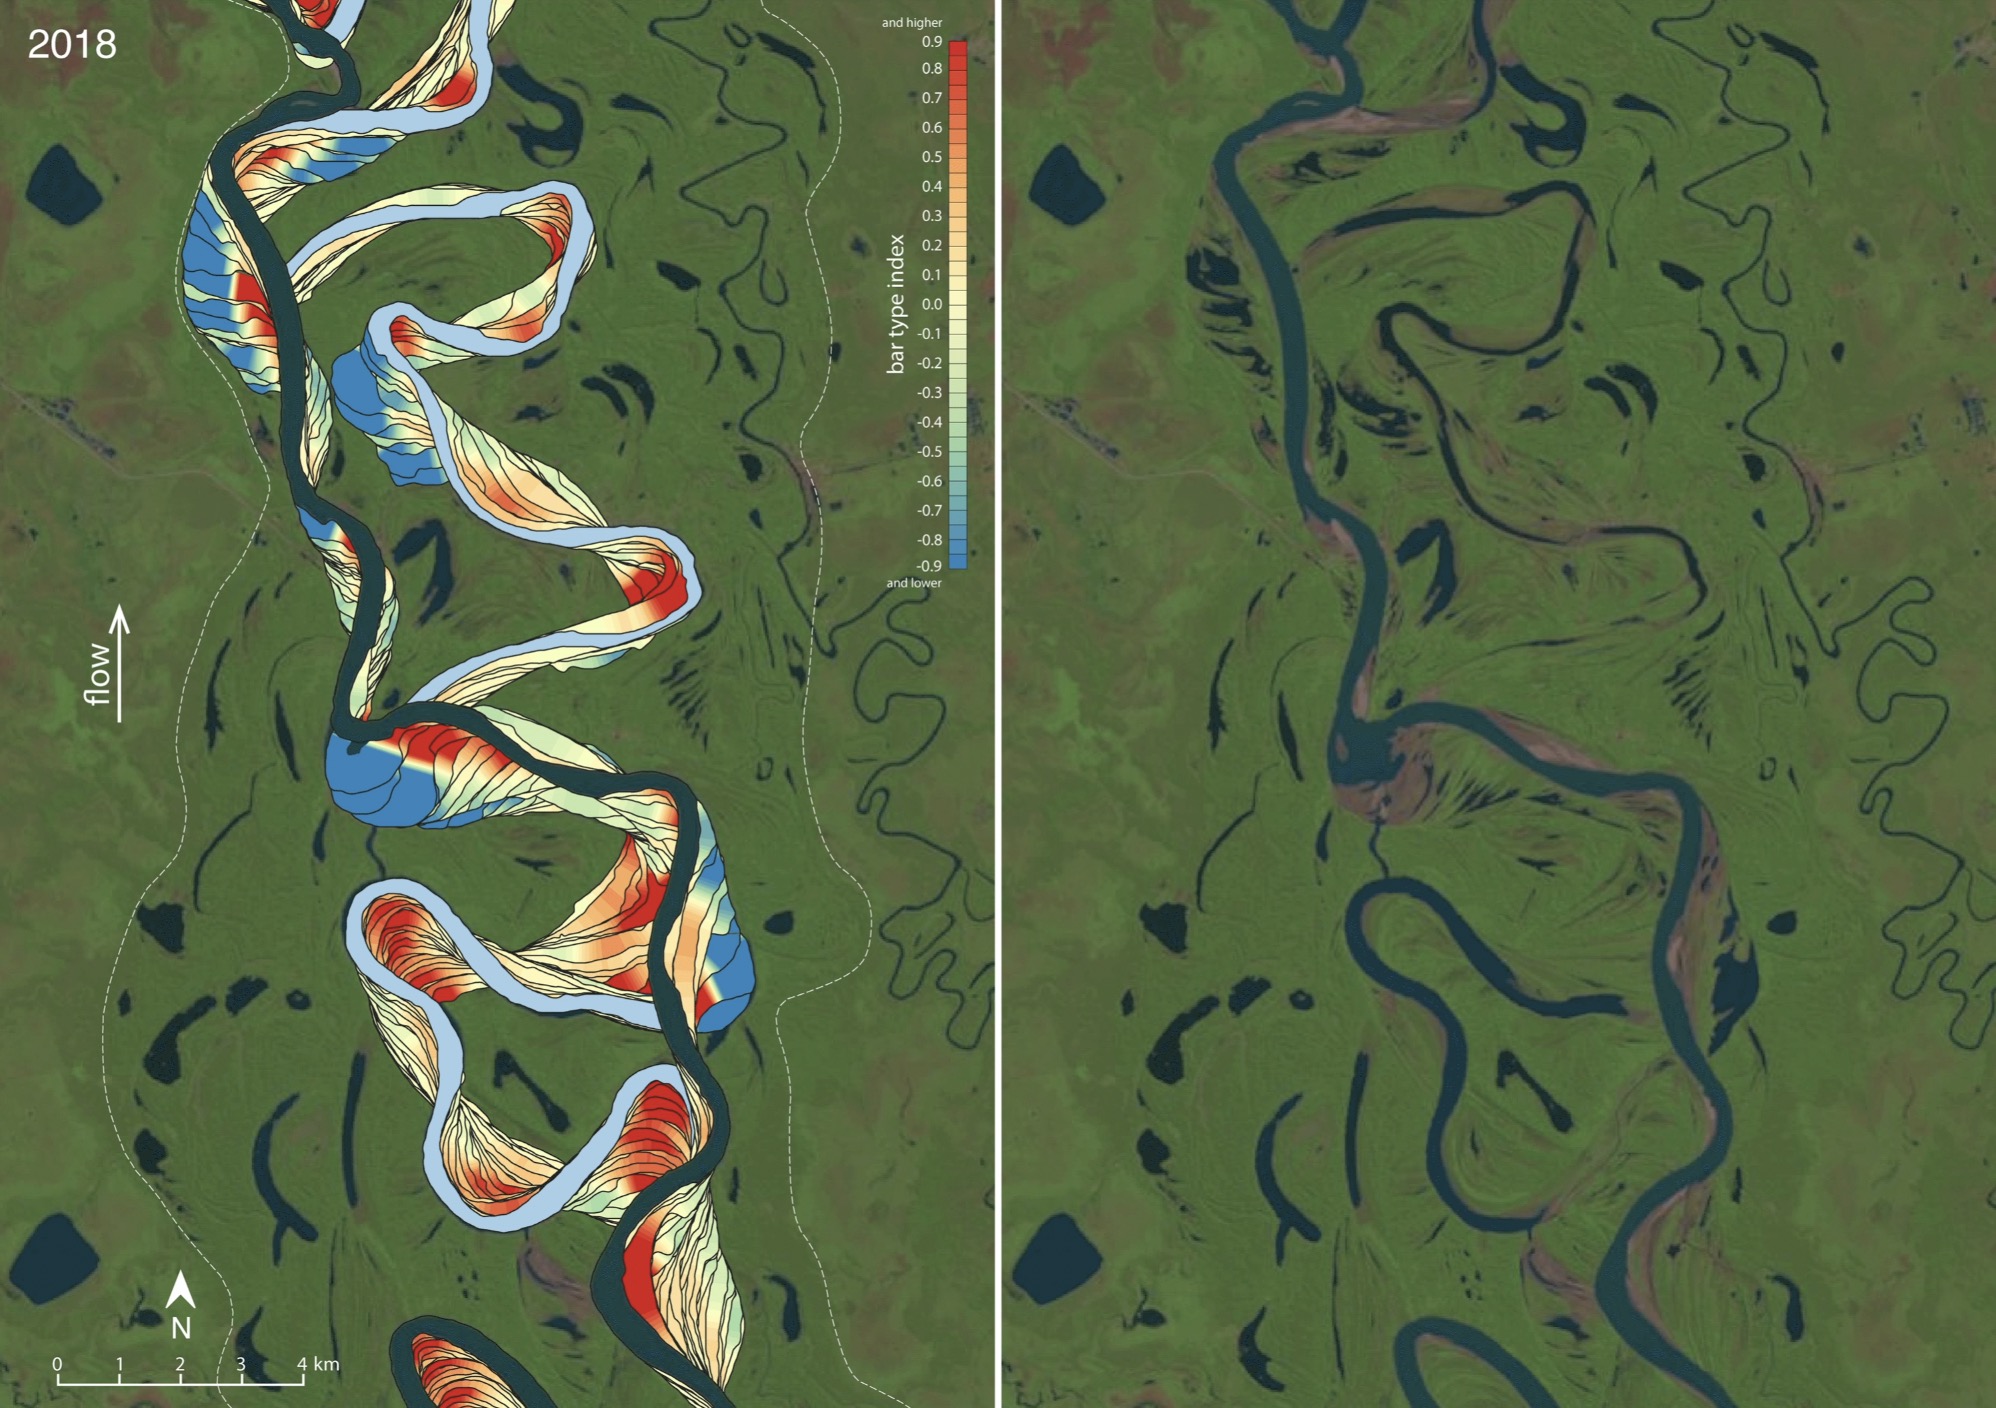
Using this approach, it is possible to map the likely locations of point bars and counter point bars. Here is an example from the Mamoré River:
Evolution of a segment of Mamoré River from 1986 to 2018. Landsat images on the right, deposits colored by bar type index on the left.
At least one of the prominent counter point bars is clearly following the erosional edge of the incised channel belt (in the upper left corner of the image), and it is likely related to the reduced erodibility of the substrate. However, the majority of the blue patches seem to have to follow no obvious erosion-resistant barriers. The large neck cutoff in the lower part of the image results in a short and sharp bend that starts rapidly migrating downstream and leaves behind a significant concave-bank deposit.
It is not just neck cutoffs that can lead to a sudden change in channel curvatures and migration patterns. Reoccupation of existing floodplain channels also disturbs the carefully crafted, slowly varying curvature of the river and results in downstream migration and counter point bar deposition:
Reoccupation of an oxbow lake and a narrow channel leads to lots of downstream translation.
Another similar example is visible in this larger-scale view:
A larger-scale view of the Mamore channel belt, with several channel reorganizations that result in counter point bar development.
Long story short, downstream translation is an inherent part of a simple but predictive model of meandering and it is common along the Mamoré River. Similar counter point bars that are unrelated to confinement seem to be common along other meandering rivers in satellite imagery. The sediments deposited on counter point bars tend to be finer grained than the upstream point bars, and, at least in some rivers, concave bank deposits are rich in mud and silt. One of the implications is that the presence of interbedded sand and mud in ancient fluvial sediments does not necessarily imply tidal influence; and does not imply significant channel-belt confinement either. Instead, we might be looking at sediments left behind by some pretty conventional meandering rivers.
Links
- PDF version of paper (open access)
- Supplemental material
- Code for channel mapping and analysis on Github
- Jackson School of Geosciences (UT Austin) press release
- Map of Mamoré River bar types as a Google Earth Engine app
- Google Earth Engine code to create the bar-type map (you need an Earth Engine account; includes shapefile data)
References
Grabau, A. W., 1920, A Textbook of Geology, Boston: D.C. Heath & Co.
Howard, A.D., and Knutson, T., 1984, Sufficient Conditions for River Meandering: A Simulation Approach: Water Resources Research, v. 20, p. 1659–1667.
Page, K., and Nanson, G., 1982, Concave-bank benches and associated floodplain formation: Earth Surface Processes and Landforms, v. 7, p. 529–543, doi:10.1002/esp.3290070603.
Smith, D.G., Hubbard, S.M., Leckie, D.A., and Fustic, M., 2009, Counter point bar deposits: lithofacies and reservoir significance in the meandering modern Peace River and ancient McMurray Formation, Alberta, Canada: v. 56, p. 1655–1669, doi:10.1111/j.1365-3091.2009.01050.x.
Sylvester, Z., Durkin, P., and Covault, J.A., 2019, High curvatures drive river meandering: Geology, v. 47, p. 263–266, doi:10.1130/G45608.1.
Sylvester, Z., Durkin, P.R., Hubbard, S.M., Mohrig, D., 2021, Autogenic translation and counter point bar deposition in meandering rivers: GSA Bulletin, doi:10.1130/B35829.1.